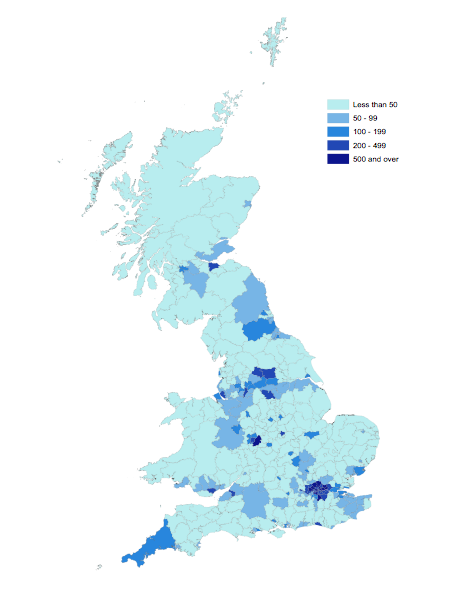
Click on the map to view where the Benefit Cap is hitting hardest.
Latest statistics about the Benefit Cap show ‘Since the introduction of the benefit cap on 15th April 2013 to December 2013:
Over 36,400 households had their housing benefit capped.
47% of households affected by benefit cap were found in London.
Of the top 20 Local Authorities with the highest number of households affected by the benefit cap, only 2 were not in London. These were Birmingham and Manchester.’
In December 2013 only the caseload showed-
‘60% of households had between 1 and 4 children and 36% had 5 or more children.
59% of households constituted a single parent with child dependants.
78% of households were capped by £100 or less.’
out the Benefit Cap show ‘Since the introduction of the benefit cap on 15th April 2013 to December 2013:
Over 36,400 households had their housing benefit capped.
47% of households affected by benefit cap were found in London.
Of the top 20 Local Authorities with the highest number of households affected by the benefit cap, only 2 were not in London. These were Birmingham and Manchester.’
In December 2013 only the caseload showed-
‘60% of households had between 1 and 4 children and 36% had 5 or more children.
59% of households constituted a single parent with child dependants.
78% of households were capped by £100 or less.’
Click here for our new Benefit Updater Course that gives you an opportunity to keep up to date and discuss all these issues.